The Resting Sell Wall, Measured Alone
We isolated the resting sell wall — one feature, no partner, no composite — and measured what it predicts second by second across six coins. The answer is the size of the next move, never its side.
Full walkthrough — streamed from YouTube.
① The shape of the resting sell wall
Before asking what the resting sell wall predicts, we look at what it is: how the quantity is distributed across its own range, per coin. The profile is heavily skewed — long stretches of very little, punctuated by rare, very large readings. Every threshold later in the study is a quantile of this shape, not a round number picked by hand.
② What it predicts, across horizons
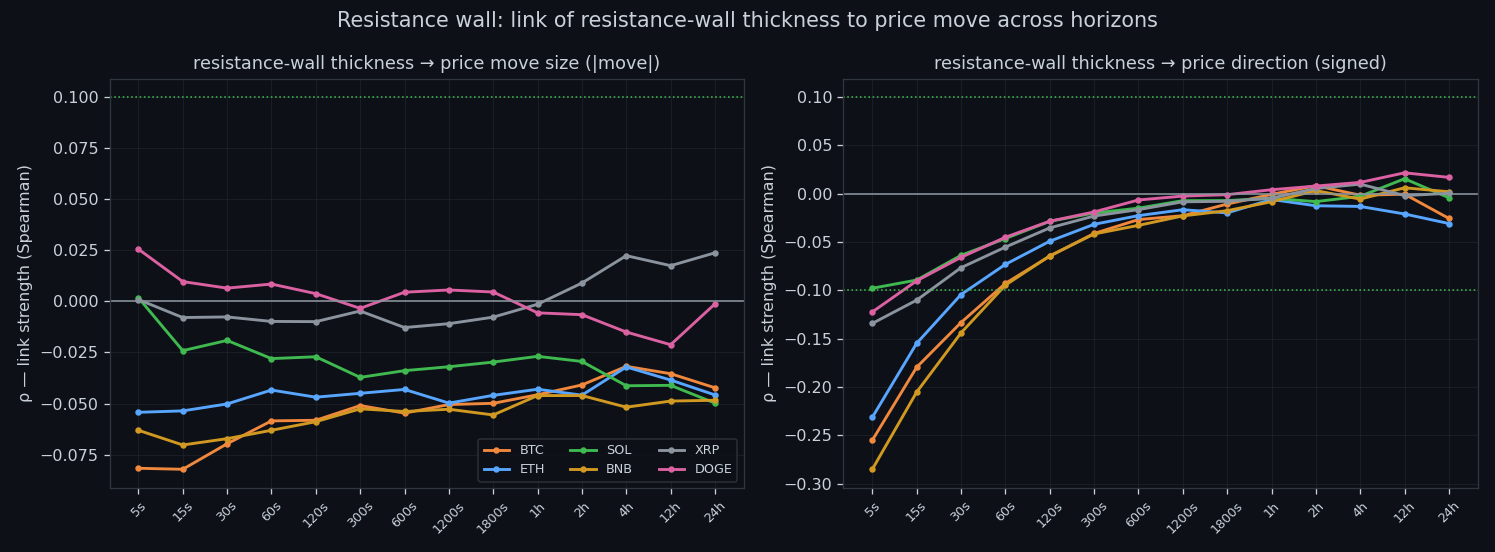
Rank correlation of the resting sell wall with the size of the next move peaks at the fastest horizon (-0.08 on BTC at 5s) and decays monotonically toward the daily scale (-0.04). Direction is a different story: the same sweep against signed returns tops out around 0.29. Size, yes; side, no.
③ Where each coin peaks
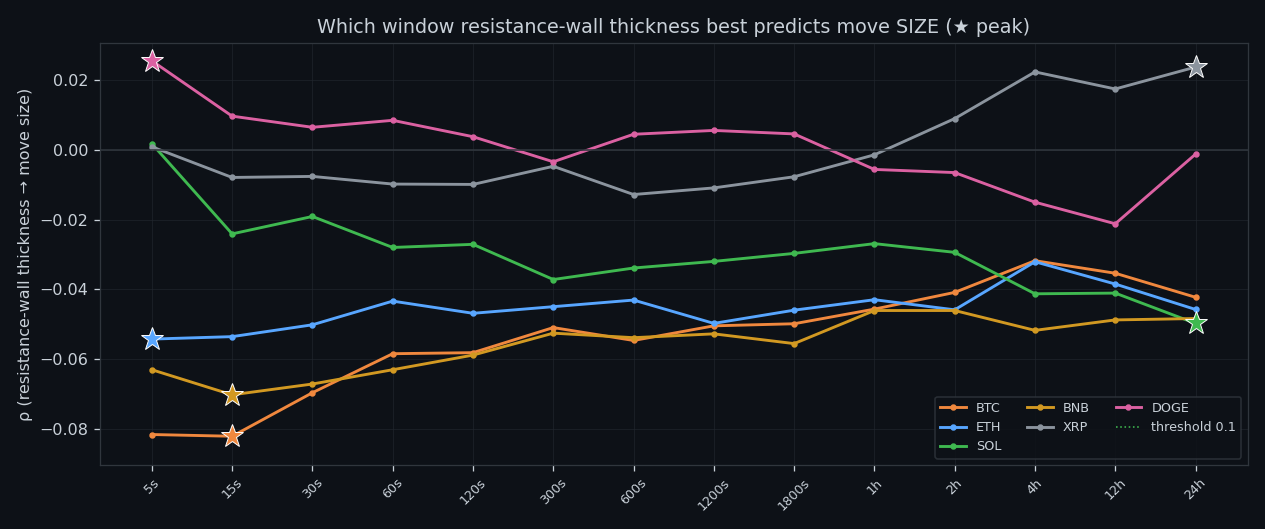
The best window differs by coin but always sits at the short end — 5s to 86400s. Anything slower than that is reading yesterday's news.
④ Price impact per unit
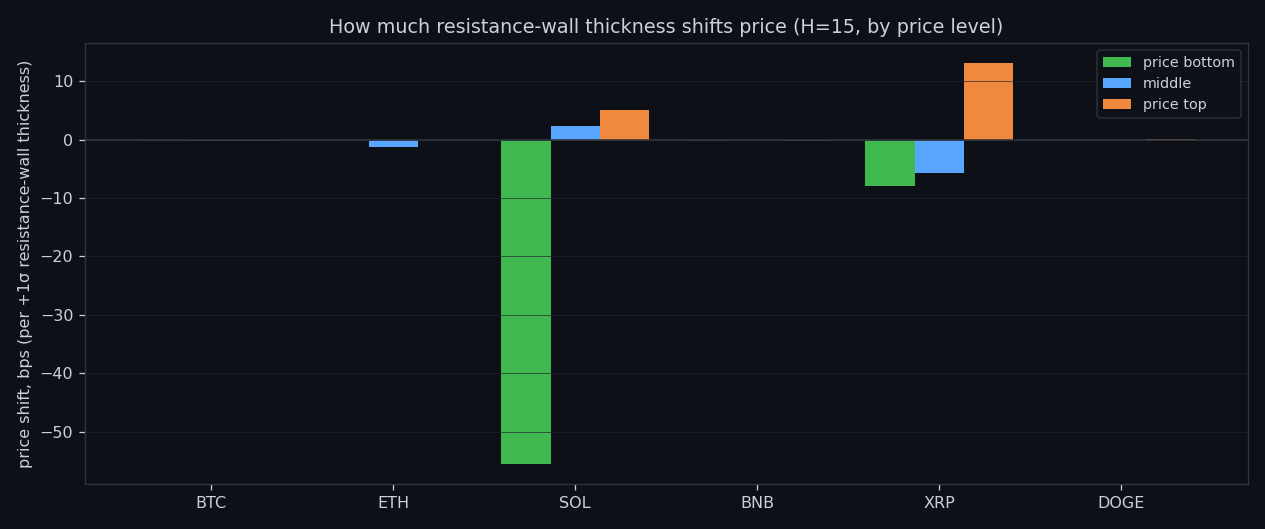
Per +1σ of the resting sell wall, price moves by a fraction of a basis point, and the sign is not stable across bands. This is the quantitative version of 'it does not push price in a usable direction'.
⑤ What counts as normal
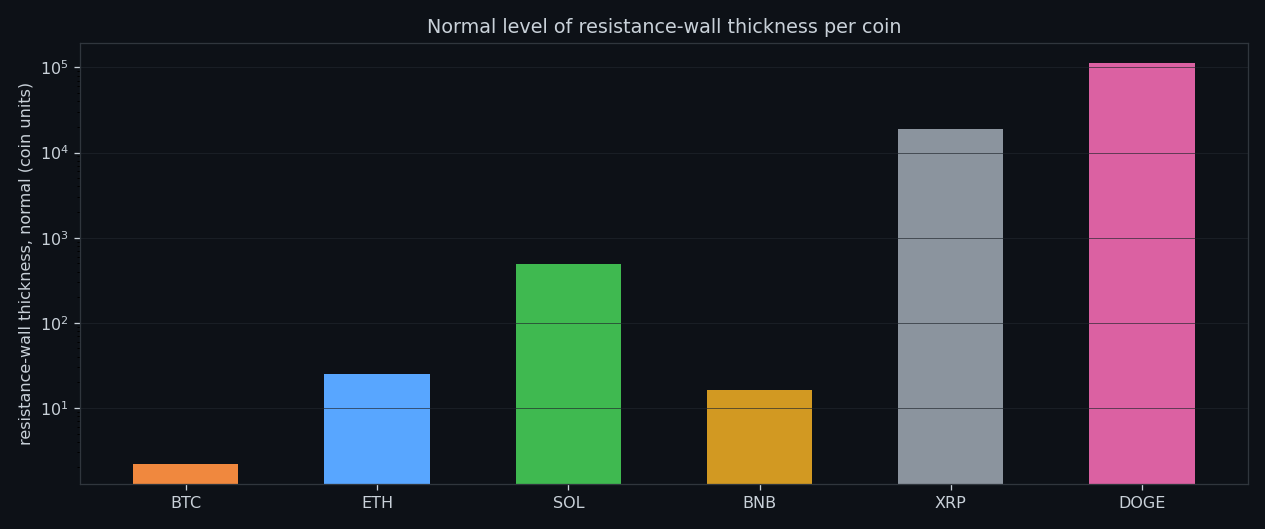
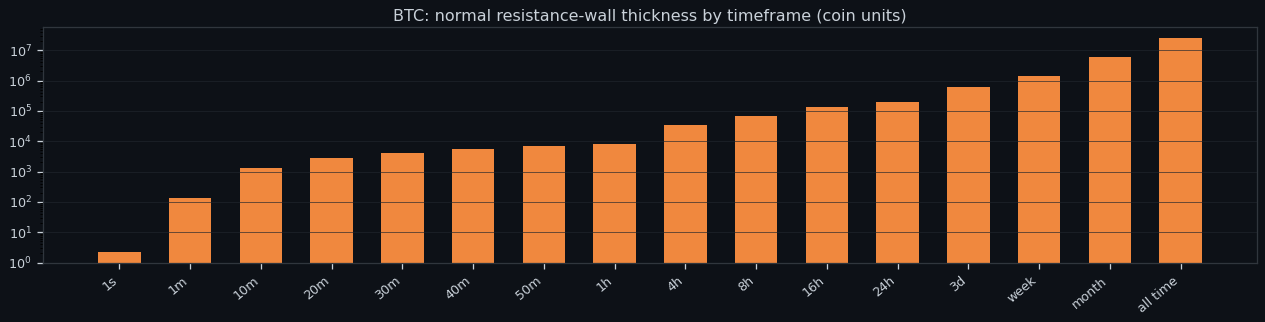
Normal levels of the resting sell wall grow by orders of magnitude from a second to a day, so 'high' is always relative to a window. This chart is the baseline every later threshold is measured against.
⑥ Memory
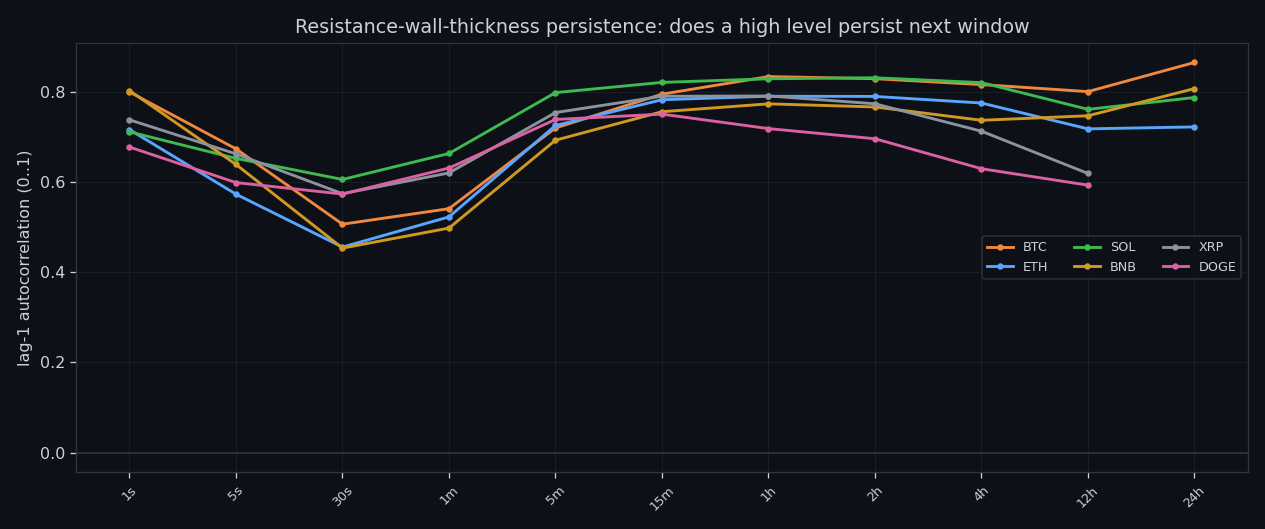
Autocorrelation of the resting sell wall starts at 0.68–0.80 at the finest scale and rises to 0.75–0.86 at intermediate windows. The quantity clusters in time: a busy minute follows a busy minute far more often than chance allows.
⑦ Where the seconds live
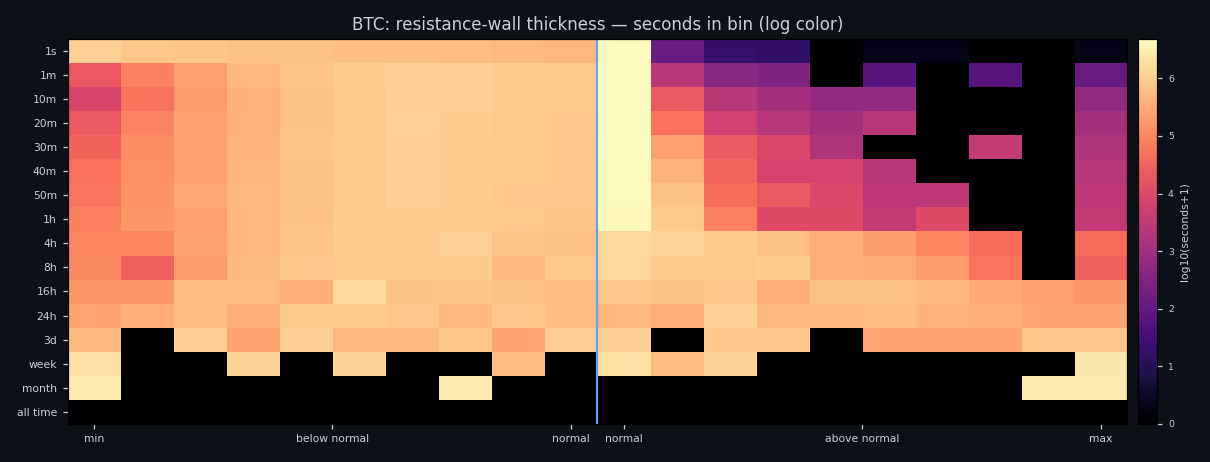
Most seconds carry almost no the resting sell wall; the interesting behaviour is confined to a thin tail. Working with means here would describe a market that does not exist.
⑧ How large the extremes get
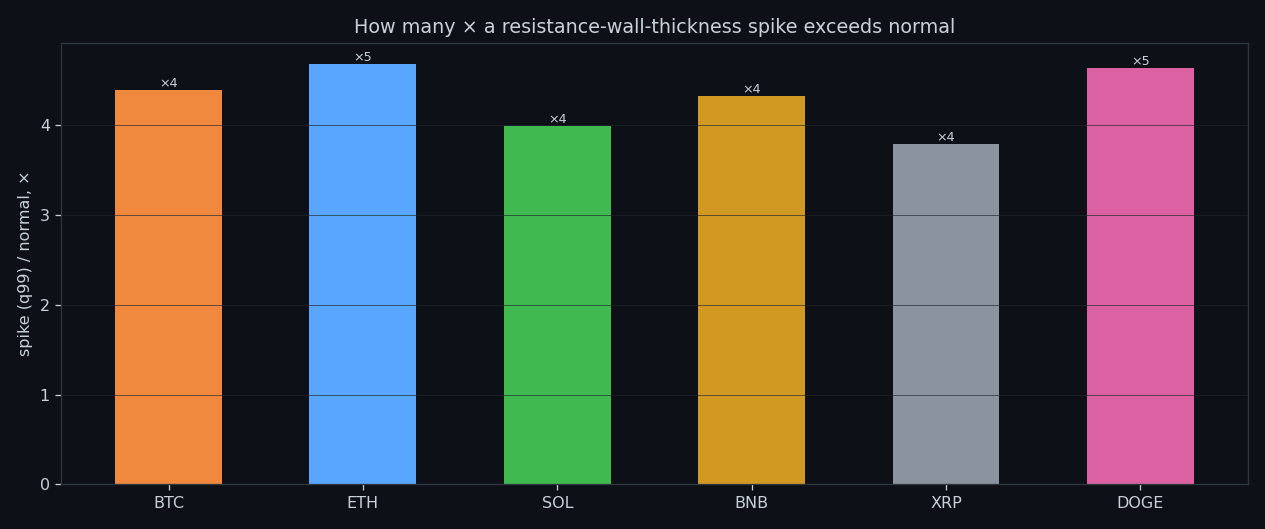
A peak second of the resting sell wall runs many times above its own normal. That ratio is what makes threshold rules feasible at all — the extremes are unmistakable once the baseline is right.
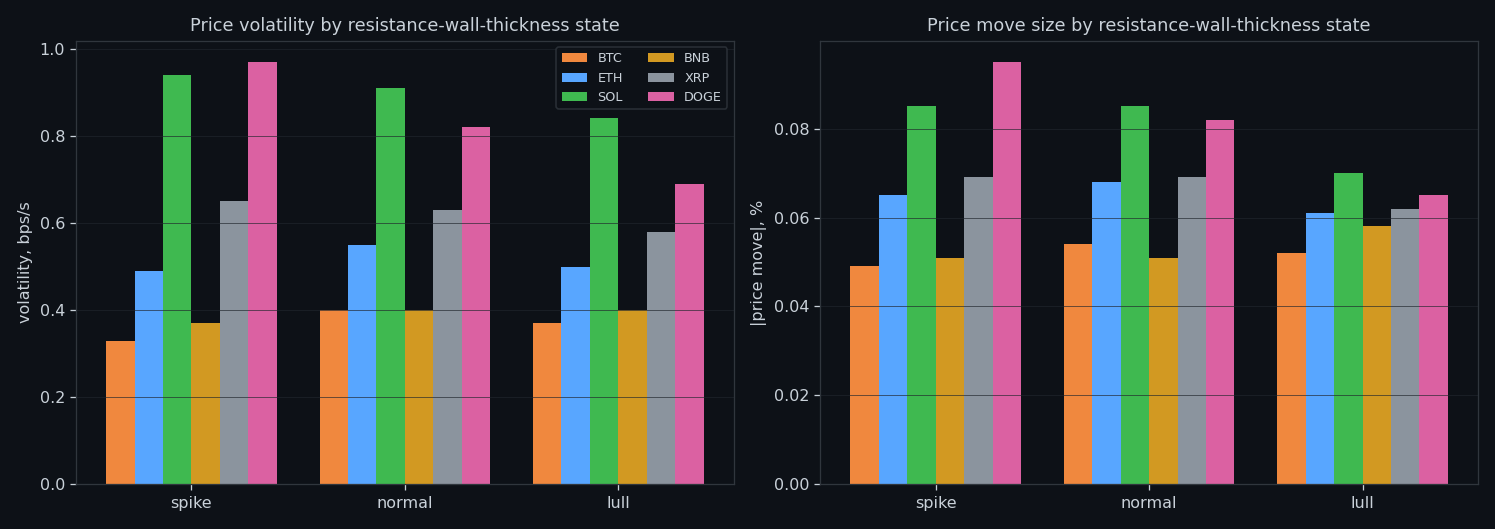
⑨ Spike, normal, lull
Every moment gets labelled relative to its own baseline. The three states separate cleanly in volatility and poorly in direction — the same result the whole project keeps producing.
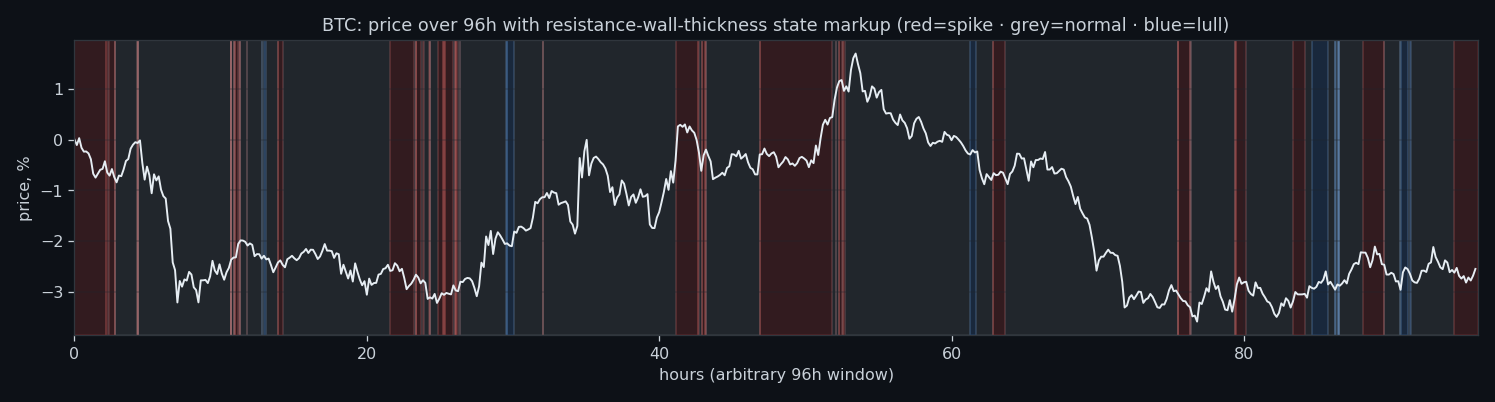
⑩ The states over price
The labelling drawn directly over a BTC price window: where the resting sell wall changes state, and what price does around it.
Research, not financial advice.
If this changed how you read the tape, the natural next step is Volume Is the Fuel — Not the Steering Wheel — We recorded the Binance order book every second for six coins over five months and ran eighteen tests on what volume really does.
Volume Is the Fuel — Not the Steering Wheel
We recorded the Binance order book every second for six coins over five months and ran eighteen tests on what volume really does.
About Market Research Lab — What We Collect and Why
Most market commentary is storytelling.
From Calm to Calm: a Standard for What Counts as a Signal (BTC)
We stopped defining market signals with a stopwatch.
The Wall That Goes Quiet: What Resting Liquidity Predicts
We measured resting limit liquidity sitting on both sides of the book second by second across six coins, and asked the only question that matters:….
Comments
Discussion is powered by GitHub. Enable it by adding secrets/giscus.json (repo IDs from giscus.app).