Bot 6, Line 60: A Bot That Mostly Waits — and What the Clock Costs It
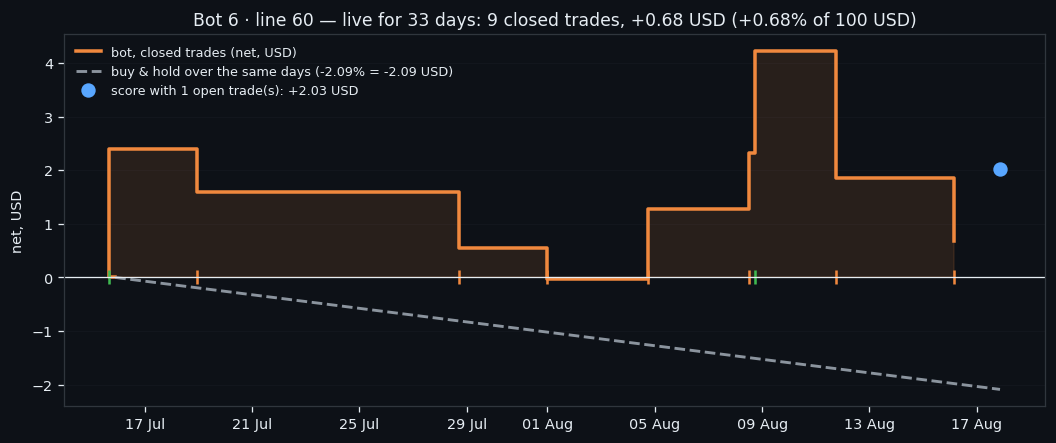
Line 60 of Bot 6 holds one position at a time and has been live since 15 July 2026: 33 days, 9 closed trades, +0.68 USD on a 100 USD slot, win rate 44%. Its entry gate is agreement between two independent models plus a context check; its exits are a 2% target, a 4% stop and a hard 72-hour clock. This is the complete record, including the comparison with its twin line running the identical recipe — which is the part that keeps us honest.
Full walkthrough — streamed from YouTube.
① One trade at a time: how line 60 works
Line 60 is one instance of Bot 6 — a bot that holds **one position at a time, across all six coins**, with a single slot of 100 USD. It has been running on live data since 15 July 2026, on paper, with a fee of 0.15% per action.
Its entry rule is a gate made of agreement rather than of thresholds. An ensemble of models scores every coin; a trade is allowed only when the ensemble's confidence clears τA = 0.618, a second, independent model agrees on the same side, and a context check confirms the wider market state. If two of the three disagree, there is no trade — and there is no fallback, no "trade the best of a bad lot". The bot simply waits.
Exits are equally plain: take profit 2%, stop loss 4%, and a hard 72-hour timeout that closes anything still open at whatever price is there. That timeout is the part to watch in the results below.
The recipe was chosen on a grid of 30 settings, on training episodes only, with one rule that threw out otherwise attractive candidates: a setting had to produce a signal in at least 60% of episodes. A gate that opens twice a year will show a wonderful win rate and teach you nothing. On the validation period the chosen recipe made +7.88 USD over 8 trades, with a median wait of 12.8 hours before a signal and 12.8 hours in the position.
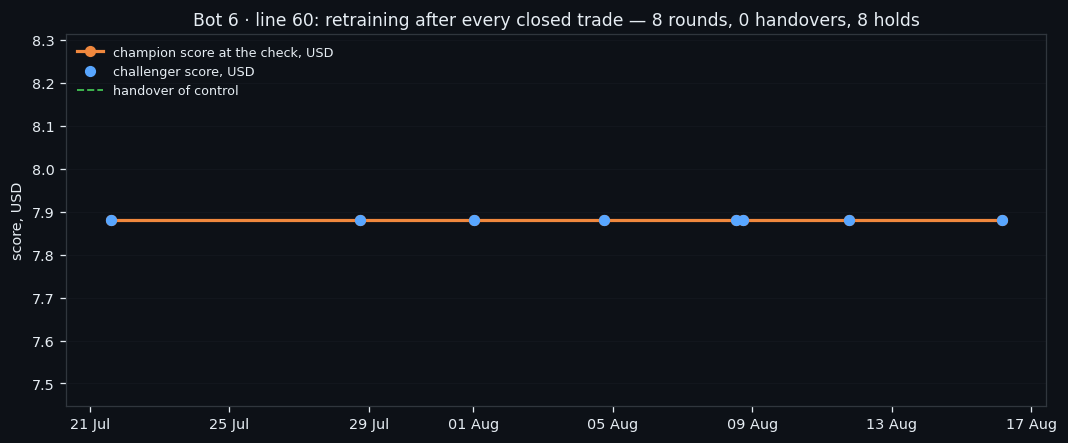
There is one more moving part. After every closed trade, a challenger is retrained on the freshest data and compared with the running version; the better one keeps the line. Line 60 is on version 1 after 8 such rounds.
② 33 days live: the numbers
As of 2026-08-17, after 33 days live:
| measure | value | |---|---| | closed trades | 9 | | net result | +0.68 USD (+0.68% of 100 USD) | | win rate | 44.4% | | average trade | +0.076% · median -0.580% | | median holding | 72.0 h | | how they ended | take profit — 2, 72 h timeout — 7 | | best / worst | ETH +2.40% / BTC -2.36% | | buy & hold, same coins and days | -2.09% on average (BNB +4.3%, BTC -1.2%, ETH -1.2%, XRP -10.3%) |
Open at the time of writing: ETH long +1.50% after 40 h — +1.35 USD unrealised in total.
One trade at a time over 33 days means roughly one closed position every 3.7 days — and that number is the most informative one in the table. This bot spends the overwhelming majority of its life flat, waiting for its three conditions to line up. Every result it produces has to be read with that in mind: with 9 closed trades, a single outcome moves the win rate by 11 percentage points.
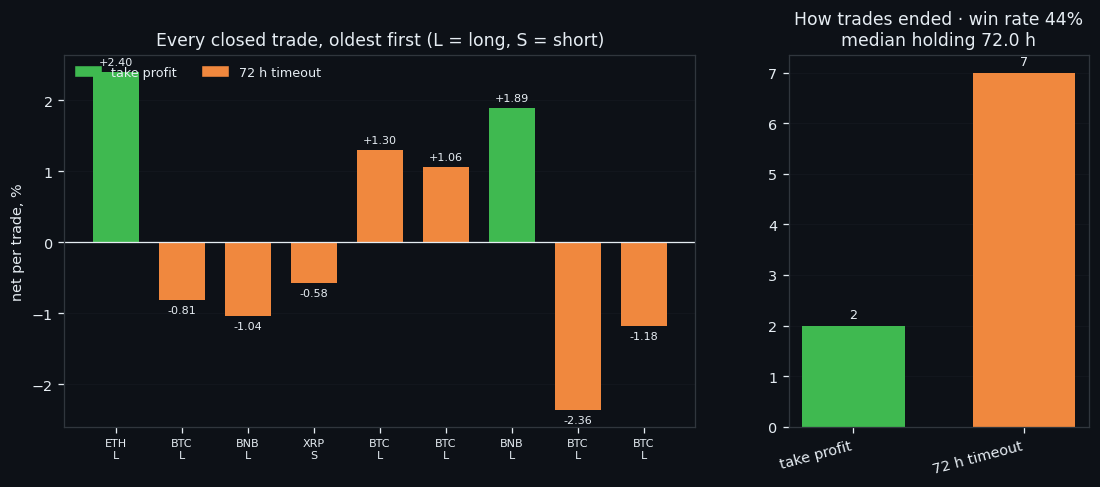
The exits column is where the mechanism shows through. take profit — 2, 72 h timeout — 7 — and the split between "hit the target" and "ran out of time" says more about the bot than the profit does. A position closed by the clock is one where the entry was not wrong enough to hit the stop and not right enough to hit the target within three days.
③ What the clock costs it
Line 60's defining number is not its profit — it is that **7 of its 9 closed trades ended on the 72-hour clock**, not at a target or a stop. The bot was right that something was happening; it was wrong, or too early, about when.
That is a specific and fixable failure, and it is worth separating from the general "the strategy does not work". A timeout exit means the entry gate opened, the position went nowhere decisive for three days, and the bot took whatever was on the table — on this line, a median holding of 72.0 hours, which is the timeout itself. The move the model saw either arrived later, or was smaller than 0.08% and never reached the 2% target.
The comparison that makes this concrete is line 61 — the same recipe, the same gate, the same six coins, launched two days apart. It closed 9 trades in 31 days for +11.81 USD at a 89% win rate, and its exits are dominated by take profits rather than timeouts. Two identical systems, one month each, 11.13 USD apart.
We are not going to explain that gap with a story about market regimes. With 9 and 9 trades, the difference is inside the range that pure chance produces, and pretending otherwise is how people end up "improving" a system into overfitting. What the pair genuinely tells us is something narrower and more useful: **the same gate produces very different outcomes depending on which entries it happens to catch**, so the next piece of work is not a better gate, it is a better exit — one that reads the state of the move instead of counting hours.
Buy & hold over the same days on the coins it traded: -2.09% on average (BNB +4.3%, BTC -1.2%, ETH -1.2%, XRP -10.3%). Line 60 finished +0.68 USD against that. Both numbers are small, both are honest, and both will be republished daily as they change.
If this changed how you read the tape, the natural next step is Volume Is the Fuel — Not the Steering Wheel — We recorded the Binance order book every second for six coins over five months and ran eighteen tests on what volume really does.
Volume Is the Fuel — Not the Steering Wheel
We recorded the Binance order book every second for six coins over five months and ran eighteen tests on what volume really does.
About Market Research Lab — What We Collect and Why
Most market commentary is storytelling.
From Calm to Calm: a Standard for What Counts as a Signal (BTC)
We stopped defining market signals with a stopwatch.
The Wall That Goes Quiet: What Resting Liquidity Predicts
We measured resting limit liquidity sitting on both sides of the book second by second across six coins, and asked the only question that matters:….
Comments
Discussion is powered by GitHub. Enable it by adding secrets/giscus.json (repo IDs from giscus.app).