The Life of a Sell Wall: Standing, Growing, Thinning
We put the three phases of the same sell-side wall — how much stands there, what arrives, what leaves into one study and asked how the pieces relate, which one leads, and what the combination predicts. Same boundary as always: it speaks about size, not side.
Full walkthrough — streamed from YouTube.
① The pieces, measured separately
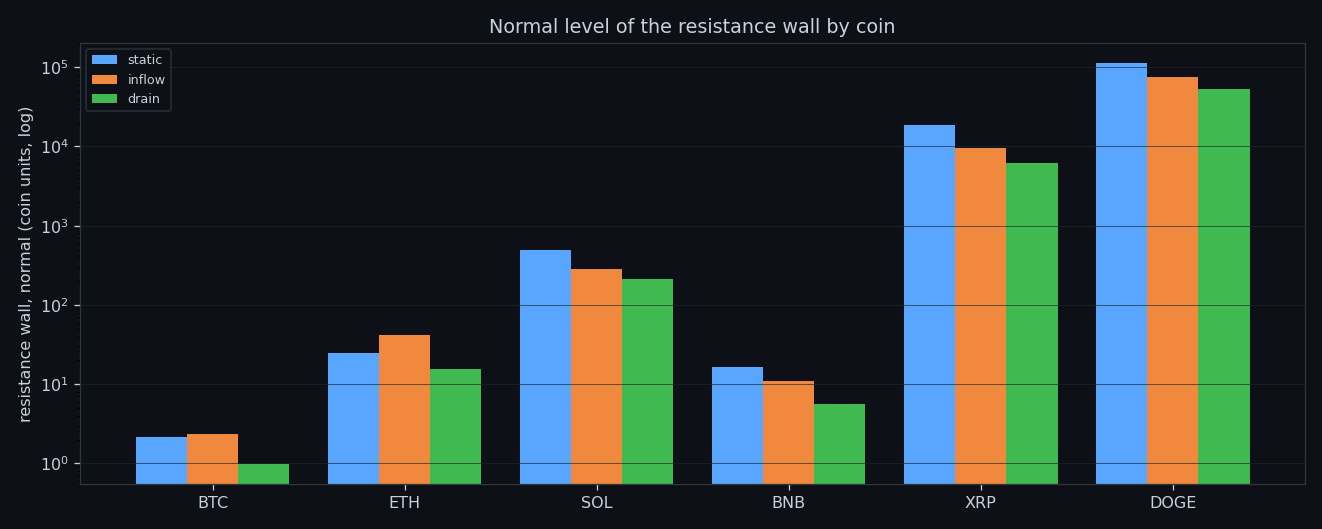
This study looks at the three phases of the same sell-side wall — how much stands there, what arrives, what leaves. Before combining anything we show each component on its own scale, per coin — otherwise a composite hides which part is actually doing the work.
② How the pieces relate
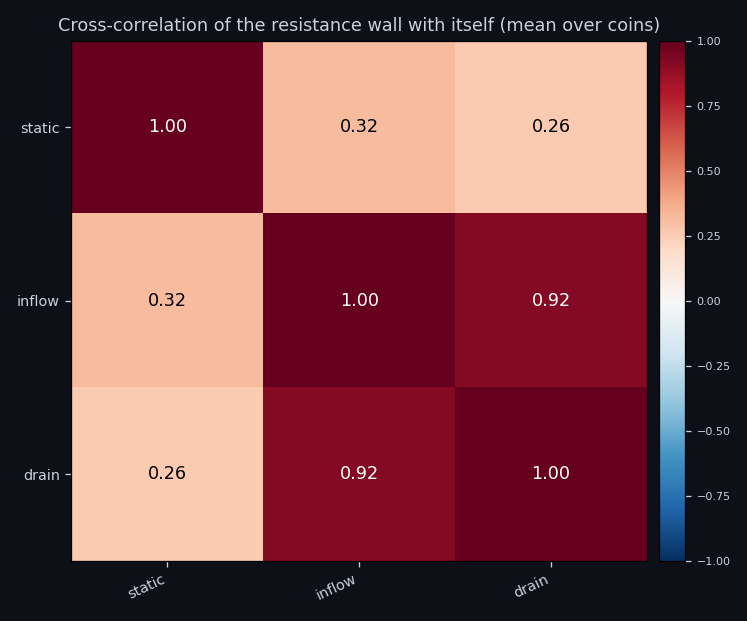
Cross-correlation between the components, averaged over coins. The strongest pairs are sell-wall build-up vs sell-wall drain +0.92; the sell wall vs sell-wall build-up +0.32; the sell wall vs sell-wall drain +0.26. Numbers near zero matter as much as high ones: they say the two quantities carry independent information and can be combined without simply repeating each other.
③ Which one moves first
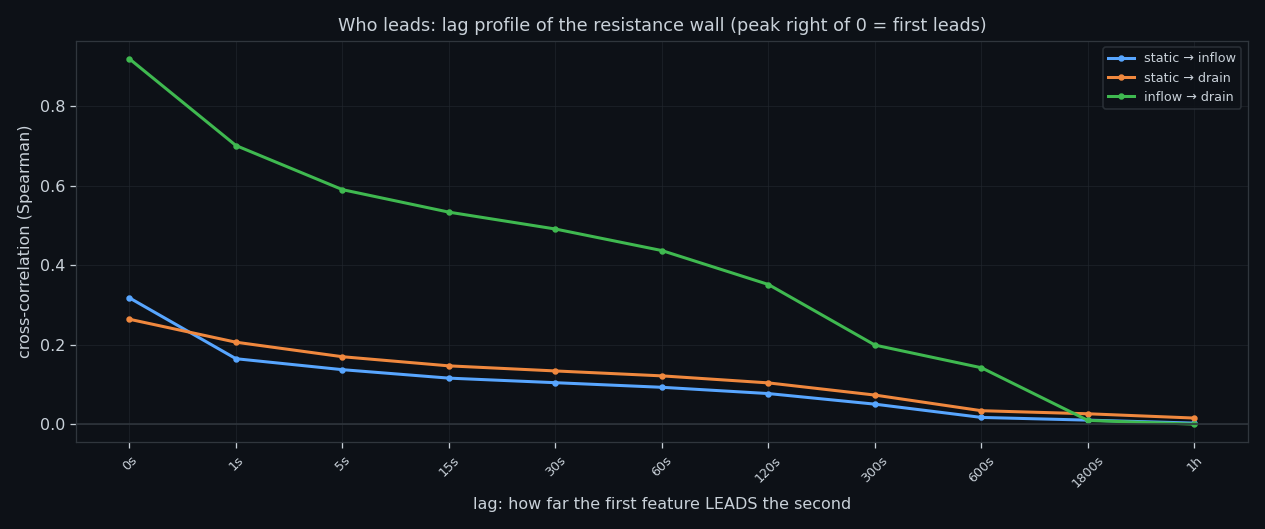
Lagged correlation answers the ordering question: when one component shifts, does the other follow, and after how long? Profiles that peak away from zero lag indicate a lead-follow relationship rather than a coincidence.
④ What the combination predicts
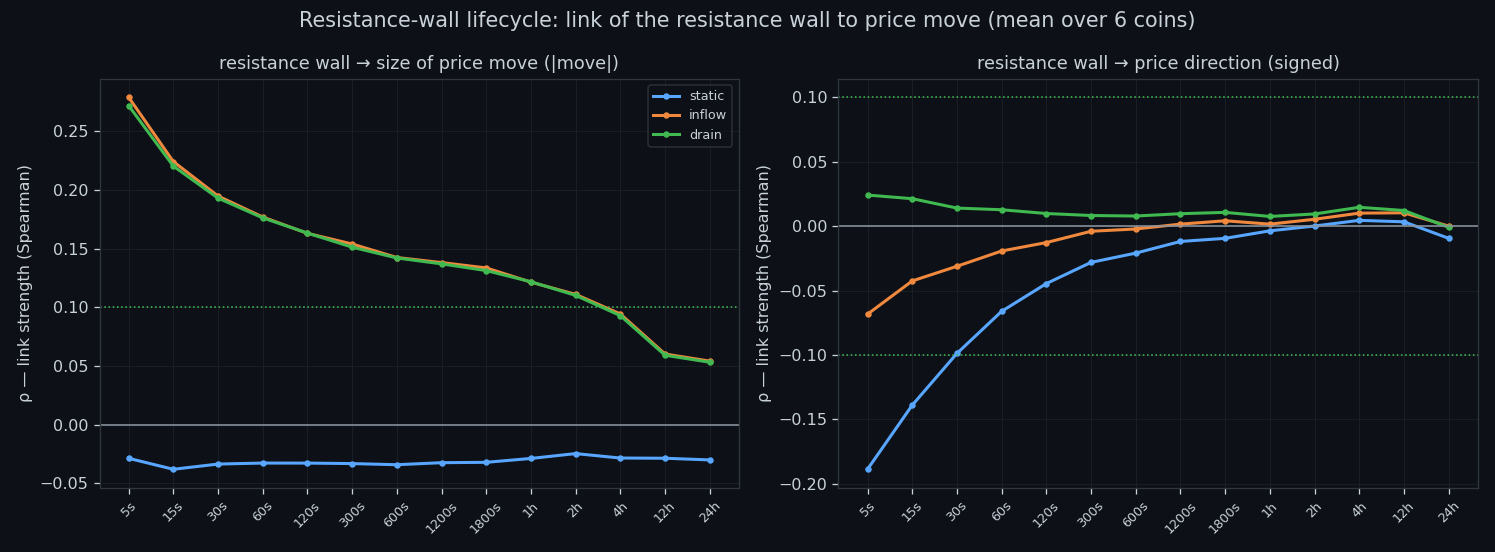
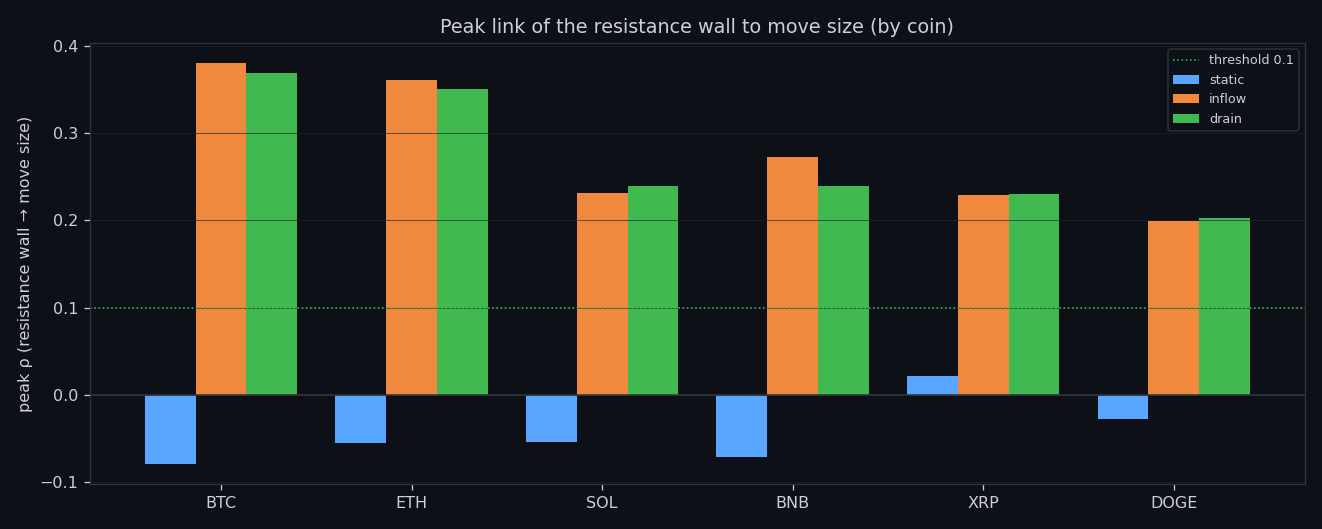
The same volatility sweep as in every study, now for the combined view: link strength against the size of the next move across horizons, per coin. As everywhere else, the usable signal sits at the short end and concerns magnitude.
⑤ Where it peaks
The best window per coin for the combined reading.
⑥ Impact per unit
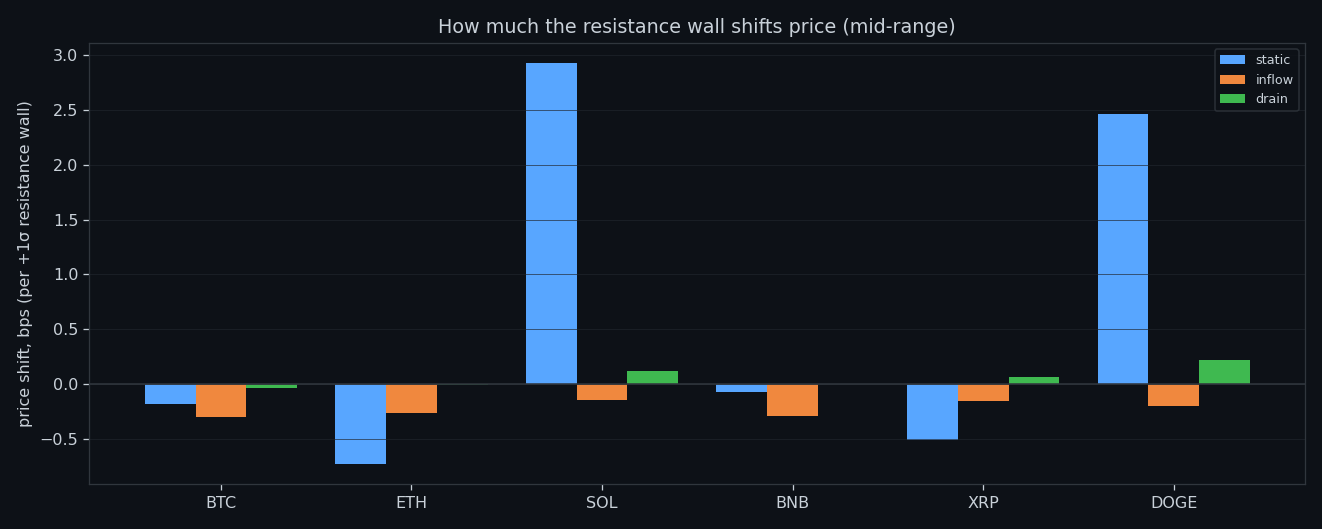
Price impact per +1σ of each component, side by side — useful to see which piece carries the mechanical push and which is merely correlated with it.
⑦ States and transitions
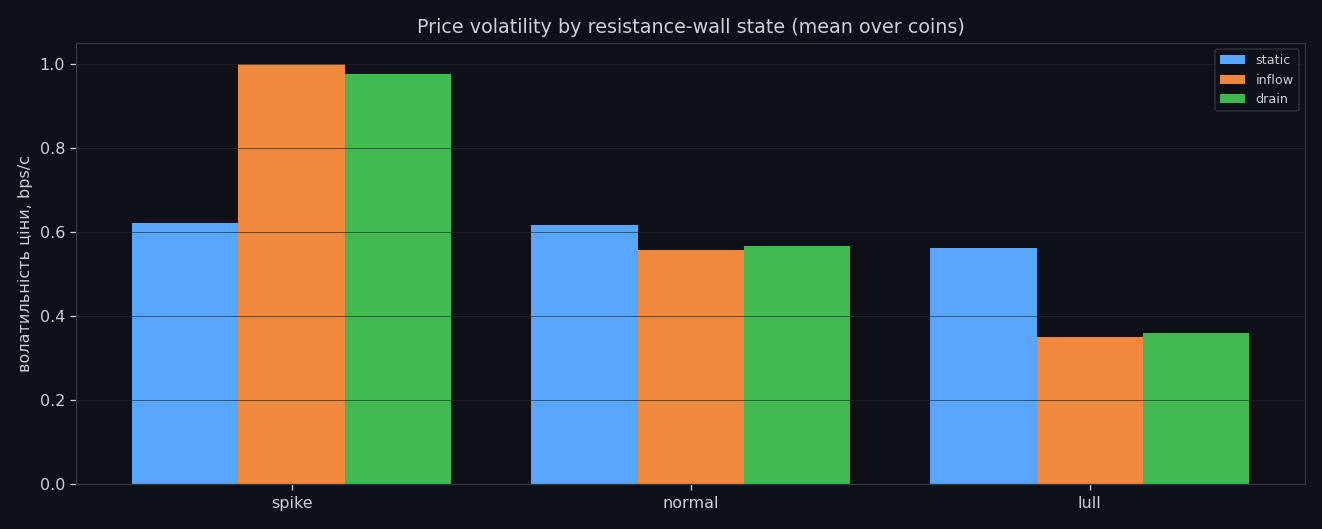
Labelled states for the combined reading, and how they hand over to one another.
⑧ Memory of the combination
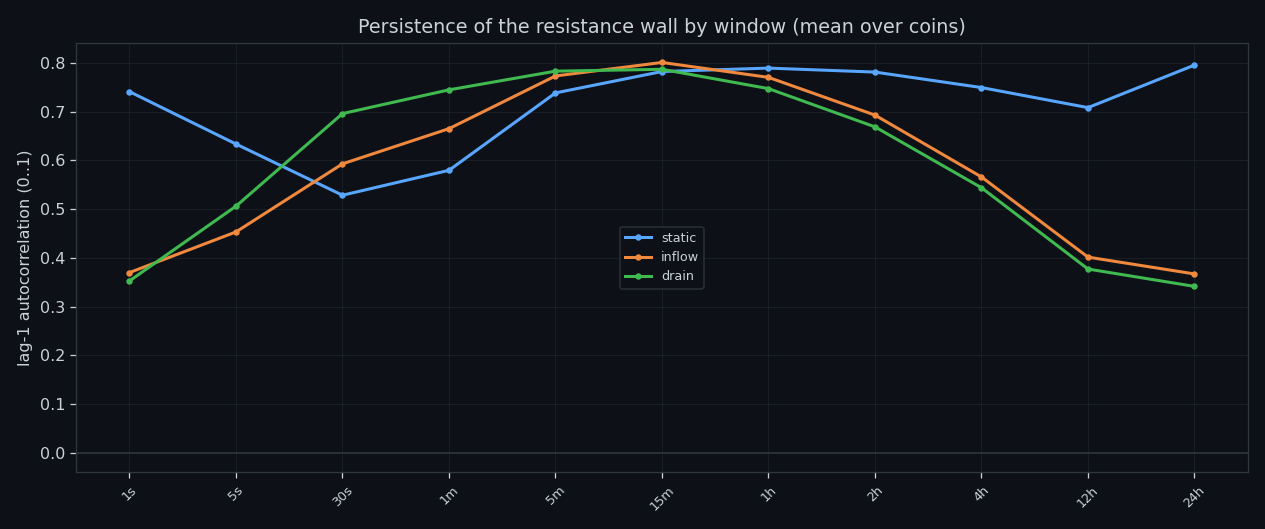
Autocorrelation of the combined reading by timeframe — the same stickiness we see in every single feature, preserved after combining.
⑨ Extremes
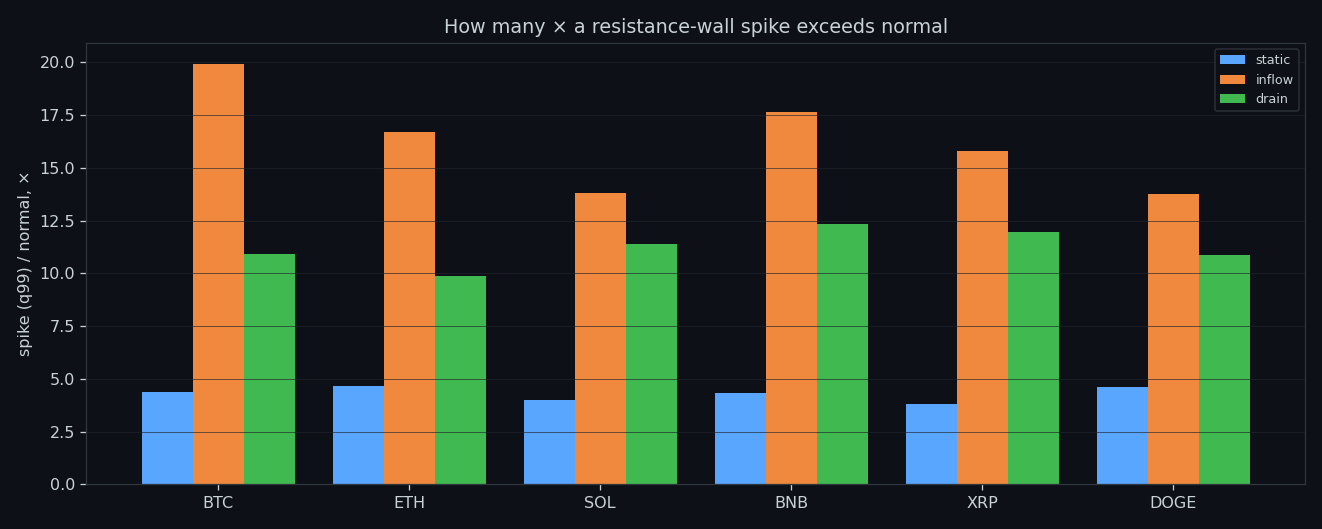
How far above normal the extremes of this combination run.
Research, not financial advice.
If this changed how you read the tape, the natural next step is Volume Is the Fuel — Not the Steering Wheel — We recorded the Binance order book every second for six coins over five months and ran eighteen tests on what volume really does.
Volume Is the Fuel — Not the Steering Wheel
We recorded the Binance order book every second for six coins over five months and ran eighteen tests on what volume really does.
About Market Research Lab — What We Collect and Why
Most market commentary is storytelling.
From Calm to Calm: a Standard for What Counts as a Signal (BTC)
We stopped defining market signals with a stopwatch.
The Wall That Goes Quiet: What Resting Liquidity Predicts
We measured resting limit liquidity sitting on both sides of the book second by second across six coins, and asked the only question that matters:….
Comments
Discussion is powered by GitHub. Enable it by adding secrets/giscus.json (repo IDs from giscus.app).