Executed Sell Volume, Measured Alone
In shortWe isolated executed sell volume — one feature, no partner, no composite — and measured what it predicts second by second across six coins. The answer is the size of the next move, never its side.
Narrated walkthrough · plays from YouTube when you press play.
① The shape of executed sell volume
Before asking what executed sell volume predicts, we look at what it is: how the quantity is distributed across its own range, per coin. The profile is heavily skewed — long stretches of very little, punctuated by rare, very large readings. Every threshold later in the study is a quantile of this shape, not a round number picked by hand.

② What it predicts, across horizons
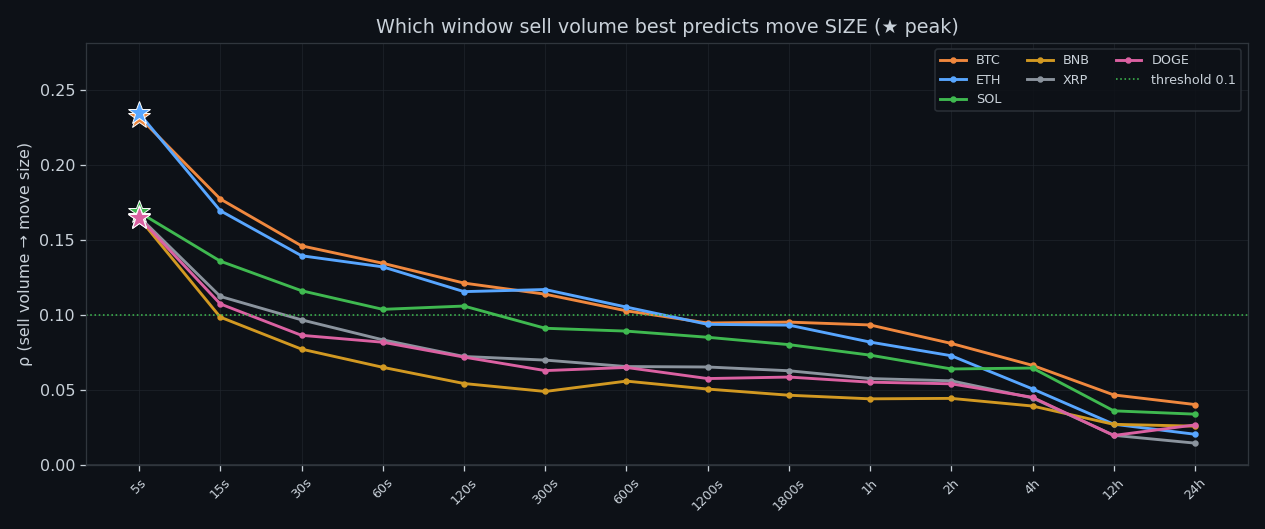
Rank correlation of executed sell volume with the size of the next move peaks at the fastest horizon (+0.23 on ETH at 5s) and decays monotonically toward the daily scale (+0.02). Direction is a different story: the same sweep against signed returns tops out around 0.12. Size, yes; side, no.

③ Where each coin peaks
The best window differs by coin but always sits at the short end — 5s to 5s. Anything slower than that is reading yesterday's news.
④ Price impact per unit
Per +1σ of executed sell volume, price moves by a fraction of a basis point, and the sign is not stable across bands. This is the quantitative version of 'it does not push price in a usable direction'.

⑤ What counts as normal
Normal levels of executed sell volume grow by orders of magnitude from a second to a day, so 'high' is always relative to a window. This chart is the baseline every later threshold is measured against.

⑥ Memory
Autocorrelation of executed sell volume starts at 0.14–0.25 at the finest scale and rises to 0.57–0.67 at intermediate windows. The quantity clusters in time: a busy minute follows a busy minute far more often than chance allows.

⑦ Where the seconds live
Most seconds carry almost no executed sell volume; the interesting behaviour is confined to a thin tail. Working with means here would describe a market that does not exist.

⑧ How large the extremes get
A peak second of executed sell volume runs many times above its own normal. That ratio is what makes threshold rules feasible at all — the extremes are unmistakable once the baseline is right.

⑨ Spike, normal, lull
Every moment gets labelled relative to its own baseline. The three states separate cleanly in volatility and poorly in direction — the same result the whole project keeps producing.

⑩ The states over price
The labelling drawn directly over a BTC price window: where executed sell volume changes state, and what price does around it.
Research, not financial advice.

All our bots have been tested live. The best one is Line 7.
More than a dozen bots were built from this research. Line 7 — two small transformers that read 160 hours of order book as one picture — is the only one ahead of buy & hold in live trading: +5.44% since 5 Oct while BTC moved −5.29%. Every trade is in the report.
Everything on this site is research, not financial advice.
How to read this site in 5 minutes · All studies as one .md for AI · All research
← All research